a demo

The number you see is the number that's true right now.
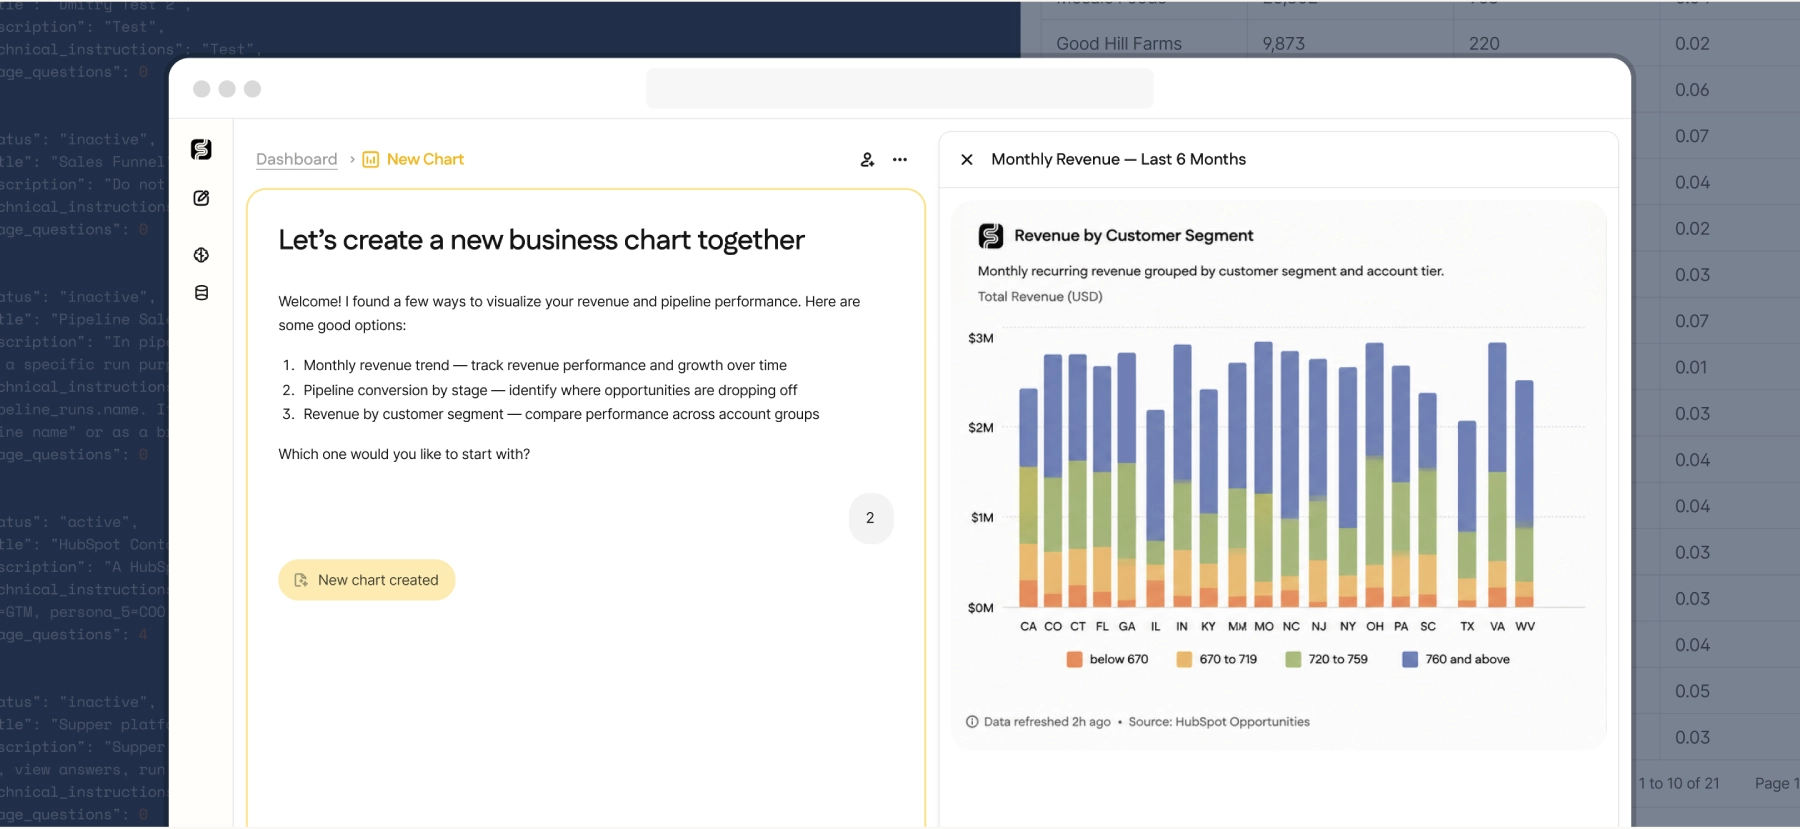
Every chart, every metric, every table queries your live data sources at load time. No scheduled refreshes to wait for, no re-pulled exports, no "is this from yesterday or this morning?" If you've built your skill around pulling numbers before meetings and hoping nothing changed, this is the part you'll feel immediately.
Live queries at every page load, not a refresh schedule
Data from your warehouse, SaaS tools, and databases in one view
Timestamp on every dashboard showing exactly when data was last queried

.svg)
Surprised by a number? Ask it directly.
Every metric is a starting point. Click into any number and the agent is right there, already aware of what you're looking at and ready to explain what drove the change, break it down, or pull the data behind the trend. You’ll never need to switch tools, open new tabs, or file tickets with the data team.
The agent knows which dashboard you're on and which metric you've selected
Ask "why did this change?" and get a real answer, not a data dump
Drill into any chart directly from the dashboard interface
One dashboard. One set of numbers. Company-wide.
Supper dashboards run on the same semantic model as every agent query and skill. Revenue means the same thing for every user at your company. Share a dashboard and everyone sees the same numbers, calculated the same way. You’ll never need to maintain parallel spreadsheets or reconcile mismatched numbers in your Monday meetings.
Same semantic model as agent queries, so definitions don't drift between tools
Role-based permissions, so people only see the dashboards they should
Shareable via link. Stakeholders who just need to read don't need tool access
.svg)
Live
1
click
200
K+
What it powers
What makes dashboards different here
Agent interactions
Any metric on any dashboard is one click from a full conversation. Ask why it changed, break it down, go deeper, all without leaving the page.
Accuracy layer
Dashboard metrics use the same definitions as every other Supper query. Your revenue on the dashboard is calculated exactly the same way as when someone asks the agent.